A geological (and geotechnical) outing to the Corinth Canal, Greece

Earlier this month I tagged along on some fieldwork to the Corinth Canal in Greece, acting as a field assistant to Dr Casey Nixon (a friend from my PhD who’s now a postdoc at Southampton University). The main aim of the trip was to thoroughly map and measure the numerous normal faults in the canal, in order to connect them to regional tectonics and to faults observed offshore. The Corinth canal is a great location for structural geology as faults can be identified and correlated between both sides of the canal, provided you can get close enough to the edge to see down! As the field assistant my main job was to record the large amount of data in a logical fashion, act as a sounding block for field discussions, and to discourage Casey from falling in the canal. I found some of the geotechnical aspects of the canal really interesting, so thought I’d write a little post with some photos!


The Corinth Canal. Taken from the road/rail bridge looking southeast. Source: Gemma Smith

The Corinth Canal. Taken from the road/rail bridge looking southeast. Source: Gemma Smith

The Corinth Canal is a spectacular place to work. The canal was built at sea level, meaning there are no locks, but resulting in very high sidewalls. At their highest the walls of the canal are 90 m high (and pretty near-vertical), while the base of the canal is only ~20 m wide. Construction started in 1881 and was completed in 1893, so the canal is now well over 100 years old. The base of the canal is lined with brickwork, as are some more precarious parts of the cliff wall. Several faults have also been bricked over – making fault interpretations a little tricky at times! The Corinth Canal represents an interesting example of the challenges of engineering in a geologically complex area, as the canal has faced numerous geotechnical issues through its history.


Landslide on the canal wall. The cliff is ~60 m high at this location. Source: Gemma Smith

Landslide on the canal wall. The cliff is ~60 m high at this location. Source: Gemma Smith


Landslides and rock falls are a major problem for the canal. This is mostly due to the extremely steep walls composed of relatively weak rock (mostly marls and conglomerates), and is exacerbated by the presence of multiple faults and fractures. Through its history the canal has had periods of complete closure due to landslides, notably in 1923 when the canal was closed for 2 years due to the collapse of 41,000 cubic metres of earth. The canal was also a target in WW2, with deliberate attempts by the German army to collapse the canal walls with explosives (in addition to sinking all kinds of objects in the canal itself to impede its use by shipping). During our fieldwork we witnessed one small rock fall at the base of the cliff, which gave us a taster of the challenges faced by those in charge of maintaining the canal.


Sediment being washed into the canal after a small rockfall. Source: Gemma Smith

Sediment being washed into the canal after a small rockfall. Source: Gemma Smith

The canal authority staff were both incredibly helpful in terms of assisting us with fieldwork logistics, and very open about the need to closely monitor the canal walls. Almost every day we ran into one of the canal authority employees whose job it was to patrol the canal with binoculars looking out for any recent slope failures. Despite our utter lack of Greek and his very minimal English, we still learnt a lot about his canal patrols from our daily encounters! We were also incredibly lucky to have a tour of the canal from the lead engineer (and his very helpful multi-lingual interpreter), who pointed out the GPS monitoring and camera surveillance installed on the most unstable parts of the canal. The canal is also regularly dredged in order to maintain its water depth and remove fallen material, and is closed every Tuesday for maintenance and checks.


Small tug boat (required for larger vessels to transit the canal) passing a region of rock falls which has been contained by the placement of blocks. Source: Gemma Smith

Small tug boat (required for larger vessels to transit the canal) passing a region of rock falls which has been contained by the placement of blocks. Source: Gemma Smith

As well as the smaller scale faults in the canal itself, which are believed to be largely inactive, there are more active regional faults for the canal to contend with. On a geological excursion under the motorway bridge which crosses the canal, we noticed what appear to be seismic dampers underneath the carriageway, illustrating one of the local geotechnical responses to the seismic hazard. A magnitude 6.7 earthquake hit the Gulf of Corinth in 1981, killing 20 people and causing significant damage to the Corinth region. The seismicity of the wider region includes the 1999 Athens earthquake and the 2008 Peloponnese earthquake.


Earthquake dampers (the round things!) underneath the Corinth motorway bridge, with a small normal fault in the canal wall to the left of the bridge. Source: Gemma Smith

Earthquake dampers (the round things!) underneath the Corinth motorway bridge, with a small normal fault in the canal wall to the left of the bridge. Source: Gemma Smith

The Corinth Canal is a great example of a large structure which may not have been built in the most geologically sensible way (fair enough considering its age!), but which is being carefully managed in order to reduce its risk. I found it a really interesting experience getting to know it for 10 days!


Tanker passing one of the larger normal faults in the canal wall. Source: Gemma Smith

Tanker passing one of the larger normal faults in the canal wall. Source: Gemma Smith

The Corinth canal area also has some friendly animal inhabitants!

A friendly Corinth resident. Source: Gemma  Smith

A friendly Corinth resident. Source: Gemma Smith

How to read earthquake maps (or – why focal mechanisms are your friend!)

Earthquake science may not be as intuitively simple to illustrate as something like volcanology, but we do definitely have the best maps. I have always been a pretty big map fan, and I think the spatial relationships in seismology and tectonics are some of the most interesting aspects of the whole discipline. However there is one aspect of seismicity maps which can be a little confusing……

Beach balls! (Ok really called focal mechanisms, but ‘beach ball’ is just much more fun). Whenever I’ve helped with teaching practicals in tectonics I have found that students can sometimes get a bit of a mental block on these and think that they are much more complicated than they really are. Once you know how to read them though, maps with beach balls on them can tell you so much about the tectonics of an area at a glance. A focal mechanism can tell you whether an individual earthquake is a thrust event (compressional), a normal event (extensional), or strike-slip. As they are also often also graded by size for magnitude and/or colour for depth, a good beach ball can really tell you a lot about what’s going on tectonically in an area. I find them so useful for getting a quick understanding of an area which I haven’t studied, or for visualising the tectonic context of a new earthquake. So basically, I think beach balls are great, and you really don’t have to be a structural geologist or seismologist to be able to get a lot of information out of them.

So how do you tell what all those little circles on maps like these mean? Beach balls are sometimes taught with stereonets, as they are a pretty similar concept, but if you understand stereonets then you’re probably already most of the way there with focal mechanisms, so I’m going to explain them from a stereonet-free perspective! I won’t go into all the nitty gritty about how they are made but I hope I can help to make maps of them seem accessible and easy to read!

Focal Mechanism examples. Source : upload.wikimedia.org

There are 3 basic shapes you will see on a beach ball:

Let’s call these:

1) Crisscross

2) Black in the middle

3) White in the middle

Let’s start with 2) and 3) as they go nicely together.

The way I remember what’s going on with a beach ball is to imagine that material is moving from white to black (or whatever shading colour is being used). This isn’t strictly what is happening (the rocks are actually being pushed or pulled according to their shading) but it just helps me to visualise what’s going on. There are occasionally maps which do the shading the other way round but it will be stated in the caption somewhere, and white is normally the ‘pull’.

So in one of these:

Extensional beach ball. Source: http://all-geo.org/highlyallochthonous


….the material is moving from the white bit in the middle, to the black sections at the side, so it is extensional (a stretching earthquake). Whereas with one of these….


…the material is moving from the white sections at the side, to the coloured section (in this case red) in the middle, so it is compressional (a squishing earthquake). These are the kind of beach balls which you’ll see with big megathrust earthquakes.

In both of these examples, you can also tell the strike (orientation on a map) of the guilty fault. A beach ball is also a mini compass, with north at the top. The orientation of the lines gives you a rough strike. In the normal fault example, the inner white section is orientated approximately NW-SE, and in the thrust fault example the red inner section is orientated approximately NNE-SSW. These give you the respective fault orientations.

That leaves the crisscross beach ball:

These are the easiest to spot at a glance, and show us that strike slip motion is occurring (you’ll see these along the San Andreas Fault, Anatolian Fault etc).

So now a map like this (which has helpfully colour coded the different types) becomes very friendly.

Selected seismicity of Italy/Croatia. Source: http://comet.nerc.ac.uk/images/fig1lo.jpg

At a glance you can see that central Italy is dominated by extension on NW- SE trending faults (‘white in the middle’ beach balls), the coast of Croatia is dominated by compressional earthquakes with the same trend (red in the middle), and that strike slip earthquakes (crisscross) are scattered around, with a couple in Sicily. You’ll also start to notice a few not so perfect examples (such as a thrust mechanism with a bit of crisscross going on). These reflect the oblique nature of many real-world earthquakes, which are often a combination of two end-members.

Easy! If you want to go a tiny bit further…..the other thing to know about beach balls is that they give you two possible earthquake fault planes. These fault planes are represented by the lines which separate the coloured and white sections. If this line runs straight across the middle of the circle then it is showing a near-vertical plane. If the line is curved round the edge, it’s a near-horizontal plane.

Therefore in our extensional example we have two possible fault planes, both of a moderate dip. This makes sense as we know that normal faults tend to have dips of ~60°. The possible fault planes dip towards the middle of the circle so this would be either a SW dipping plane or a NE dipping plane. There’s no way to tell which plane actually generated the earthquake without other external information.

6

Arrows point to potential fault planes

On our thrust beach ball, we are presented with two very different possible planes, rather than the symmetry of the normal beach ball. You do also get symmetrical thrust beach balls, but this is a nice example of what is commonly seen with megathrust earthquakes. This beach ball is telling us that the earthquake either occurred on a very shallow plane (the one running along the edge of the circle), or a very steep plane (the one running straight down the middle). In this case our geological knowledge can be helpful. We know that thrusts like to dip at a shallow angle, in some cases very shallow (<5°), so the shallow plane is a definite possibility. We also know that a vertical thrust would be geometrically unusual, so the very steep plane is pretty unlikely. If you see a beach ball like this in a subduction zone setting, its generally a pretty safe bet that the earthquake has occurred on the shallow subduction zone megathrust (with implications for tsunami hazards etc.)

7

Arrows point to potential fault planes

Lastly our strike slip example. Remembering that material ‘moves’ from white to red, you end up with a couple of options. You can definitely tell that the fault plane is likely to be pretty much vertical, as both of the lines run straight across the ball. This fits with what we know as strike slip faults like to be pretty steep, if not perfectly vertical. This beach ball therefore gives us two scenarios.

Arrows indicate direction of movement, with associated fault plane highlighted in green

Arrows indicate direction of movement, with associated fault plane highlighted in green

A sinistral (movement to the left) earthquake on a ~ SW-NE fault, or…..

Arrows indicate direction of movement, with associated fault plane highlighted in green

Arrows indicate direction of movement, with associated fault plane highlighted in green

…..a dextral (movement to the right) earthquake on a ~ NW-SE fault.

The best way to know which is right – is to look at a map! Strike slip faults often have a surface expression (or will have been helpfully interpreted onto the map), so if you can see a likely culprit fault, you’ll be able to match it to the correct plane on the beach ball.

Beach balls have even more exciting uses when you plot them in 3D, but for now I hope that helps make beach balls maps more approachable.

If you’d like to know more about how beach balls are made, this video from IRIS is excellent!

The top 10 most earthquake vulnerable cities according to Swiss Re

A couple of weeks ago, the reinsurance company Swiss Re released its annual list of the cities it considers to be the most at risk from natural hazards. This report always makes for interesting reading, and the overall rankings which consider all 5 evaluated hazards have been helpfully covered by the Guardian and others. In this post I wanted to ‘zoom in’ a little to look specifically at the earthquake rankings.


How is it calculated?


Swiss Re takes 616 large metropolitan areas with a combined population of almost 1 billion, and assesses their risk exposure to storms, storm surges, earthquakes, tsunamis, and river flooding. Two indicators are considered: the number of people potentially affected by one or more risks in a given area, and the economic effects of these events based on the value of working days lost. A number of assumptions are followed regarding the proportion of a metropolitan area likely to be affected by different hazards, for example, a storm is more likely to affect a whole city than a river flood. For economic losses, the value of the predicted losses relative to the individual country’s economy is calculated, as well as a global index.


Earthquake hazards


Earthquakes potentially affect 283 million urban dwellers as defined by the study. The most earthquake-exposed city is the Tokyo-Yokohama metropolitan area, followed by Jakarta, Manila, Los Angeles and Osaka-Kobe. The report concludes that ‘while the danger faced by American and Japanese cities is well known, the loss potential from earthquakes in Central Asia and the Northern Anatolian Fault in the Middle East is significant and often overlooked’. This is an important point as Central Asia in particular is a region where the specific form of seismogenic faulting is often less clear than at major plate boundaries, and where intraplate faulting can pose a significant and unpredictable hazard.


Image

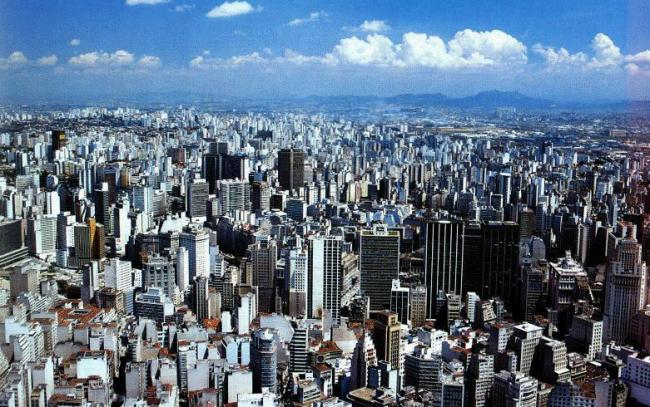
The Tokyo-Yokohama metropolitan area, the most vulnerable region to earthquakes according to Swiss Re.
Source: beautifulcities2011.blogspot.com

Another interesting factor considered is the resilience of a given country’s economy to the damage of one city. Japan is given as an example for having a degree of redundancy in its economy as there are several large economic centres (so if one suffers an earthquake the others can ‘pick up the slack’ to some extent). Costa Rica on the other hand is given as an example of a country in which the capital and primary economic centre (San Jose) is vulnerable to earthquakes, with few secondary economic centres to mitigate the damage. Therefore an earthquake in a location where an entire, perhaps smaller, country’s economy is centred on one city could be devastating to the economy of that country, even if the international effects are smaller. The Haiti earthquake is a good example of the vulnerability of smaller nations to this kind of scenario.


Image

Plot of the metropolitan areas most at risk from earthquakes.
Source: Swiss Re Mind the Risk report 2014


This plot from the Swiss Re report shows this in a graphical form. The size of each circle represents the population size of each city, and the coloured chunk of the pie chart shows the proportion of the city’s population which is considered vulnerable to an earthquake. The position of the circle on the plot is generated from the economic effects an earthquake in a given city would have on their country, and on a global scale. Cities which plot in the upper right corner are those which would have severe repercussions both on a country and global scale. Those in the upper left quadrant would have a lower global impact, but still be extremely damaging in relation to their country’s economy (generally less developed, capital centric economies). The lower right quadrant shows cities which would have a large global impact, but a lower impact relative to their countries economies (generally more developed, multi-city economies). The lower left quadrant represents lower impact events, and so is fairly empty, as this study is focused on high risk events!


The top 10 riskiest cities for earthquakes according to population size potentially affected are:


1. Tokyo-Yokohama (Japan)

2. Jakarta (Indonesia)

3. Manila (Philippines)

4. Los Angeles (USA)

5. Osaka-Kobe (Japan)

6. Tehran (Iran)

7. Nagoya (Japan)

8. Lima (Peru)

9. Taipei (Taiwan)

10. Istanbul (Turkey)


Most hazardous tectonic settings


The list is clearly dominated by Asian cities (and Lima) located along subduction zones. The tendency for large cities to develop in coastal areas clearly increases their vulnerability to seismic hazards, and associated tsunami. Subduction zones are so hazardous due to the length and width over which they can rupture. Strong coastal shaking can be experienced over a wide area and often for a longer duration than other forms of rupture. These features combine to make subduction zone earthquakes extremely damaging, as we have seen clearly in recent years.  The only cities in the top 10 by population not located on a subduction zone are LA, Tehran and Istanbul.


Istanbul sits on the North Anatolian fault, a large strike-slip system which has historically been one of the more predictable faults in terms of earthquake locations. Unfortunately for Istanbul, most predictions of where the next earthquake along this fault will occur show Istanbul as being in a very vulnerable position. Add to this a large amount of unregulated construction being undertaken in order to house a rapidly growing population, and it becomes evident why Istanbul made the list.


Tehran is located in a region of continental collision between the Arabian and Eurasian plates on the edge of the Zagros fold and thrust belt. It has a complex local tectonic setting and the city is riddled with thrust and strike-slip faults. The city is also built in a region of thick sediment (in a similar manner to Mexico City), increasing the chances of amplified shaking, liquefaction, and the occurrence of hidden faults under the city. To an even greater extent than Istanbul, a lack of strict building codes and dense population makes Tehran a very dangerous location.


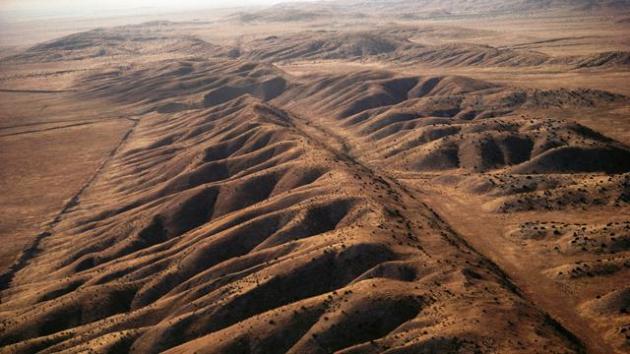
The only North American city to feature, LA is famously located on the San Andreas Fault. Similar to Tehran, LA also experiences thrust faulting due to being located on a bend in the San Andreas Fault leading to a ‘transpressional’ setting, essentially a mixture between strike-slip and thrust behaviour. The Mw4.4 and Mw5.1 earthquakes which occurred in LA last month were both prime examples of this, with a focal mechanisms revealing a combination of strike-slip and thrusting. The 5.1 earthquake has been linked by the USGS to the Puente Hills thrust, a blind thrust fault which extends under the city. The occurrence of blind (buried under sediment) thrusts in the LA region increases its vulnerability as these faults are much harder to identify and monitor. LA may have stricter seismic codes that many of the other cities of the list, but its many unreinforced concrete buildings would still be extremely vulnerable in a large quake, and it is now to some extent a race against time to retrofit these buildings before a larger earthquake strikes the city.


Image

The San Andreas fault looking very obvious, but its the sneaky ‘blind’ faults which are more worrisome for LA.
Source: http://www.bbc.co.uk

The Swiss Re hazard list obviously can’t account for everything, but I find it a really interesting economic perspective on earthquake research. Science perhaps has a slight tendency to focus on ‘fashionable’ topics, and impact studies like this can help to highlight or remind us where the largest benefits may be felt by our continued efforts to understand earthquake hazards.

The Forgotten Subduction Zone – Have you heard of the Makran?

Everybody’s heard of Tohoku-Oki. Banda Aceh (or Sumatra at least) is also firmly on the map. These places achieved notoriety through being the locations of the largest and damaging recent subduction zone earthquake events. With a combined death toll of over 300,000 people and billions of dollars of damage, the Sumatra 2004 and Tohoku-Oki 2011 events firmly shook the dangers of megathrust earthquakes back to the top of public and scientific consciousness. But have you heard of the Makran? The Makran is a potentially dangerous subduction zone which is decidedly less well known. This margin was the subject of my PhD, so here is a little blog post about why we should keep an eye on it!


Damage from the Tohoku-Oki earthquake and tsunami Source: www.eqecat.com

Damage from the Tohoku-Oki earthquake and tsunami
Source: http://www.eqecat.com

Prior to 2004, the Sumatra-Andaman subduction zone was considered by some to be unlikely to generate a very large (Mw>9) earthquake. One reason for this was that the oceanic plate heading into the subduction zone has a lot of sediment sat on top of it, partly due to the presence of the huge Bengal submarine fan to the north. Sediments like this were inferred to be too unconsolidated (mushy) to support the brittle rupture of an earthquake, and therefore sediment-rich margins such as Sumatra were historically considered to pose less of an earthquake hazard. Both the Sumatra and Tohoku-Oki events likely seismically ruptured the shallowest part of their plate boundaries, the parts closest to the trench and in the deepest water. This is part of what made their tsunamis so damaging – a rupture in deep water means that a larger body of water is affected, leading to higher tsunami heights. At Sumatra at least, this shallow part is also likely to largely consist of sediment.


This leads us to the Makran, the subduction zone which my PhD focused on. Off the coast of Pakistan and Iran, the Makran is often actually cut off the maps of ‘global’ subduction zones entirely (along with its salty friends the Mediterranean and Hellenic subduction zones). The number of papers I optimistically opened during my PhD only to find a map starting in eastern India and ending somewhere in the Atlantic, thereby neatly missing off Europe, Africa the Middle East and a good chunk of Asia, was irritating to say the least. So why has the Makran been so abandoned? I think the main reasons are a historical lack of data, relatively low earthquake activity (though this is hardly unique to the Makran), perhaps being located in a slightly problematic part of the world, and generally just being a bit of an odd one. Since the Sumatran earthquake however, there has been some rekindling of interest in the Makran, or ‘the other Indian Ocean subduction zone’.


A handy map of the location of the Makran.  Source: clasticdetritus.com

A handy map of the location of the Makran.
Source: clasticdetritus.com

Just as the Sumatran subduction zone is loaded with sediments from the Himalayas courtesy of the Bengal Fan, the Makran subduction zone is loaded with sediments from the Himalayas courtesy of the Indus Fan. There are currently up to 7 km of sediment on top of the incoming Arabian Plate, at least 4 km of which are Indus related. In comparison, the region of Sumatra where the 2004 rupture occurred has 4-5 km of sediment and Tohoku-Oki has less than 1 km. The thick sediments in the Makran have created a subduction zone with no discernible trench and the largest accretionary prism on the planet.


The Makran has one significant recorded, historical earthquake on its record, a magnitude 8.1 event which occurred in 1945 and killed ~4000 people. This earthquake caused a large tsunami on nearby coastlines, with reported wave heights of up to 15 m. This event alone illustrates the potential of this region for destructive earthquakes, however even this earthquake is relatively poorly understood when compared to many other megathrust events. Key questions about the structure, shape and sediment properties of the Makran subduction zone also remain, creating a less than ideal situation for making hazard assessments. My PhD aimed to fill in some of the knowledge gaps regarding the Makran’s structure, shape and earthquake potential, therefore allowing it to be compared more meaningfully to other margins, and allowing better-informed seismic hazard assessments to be undertaken.


Through interpreting a large 2D seismic dataset (allowing us to see the plate boundary and associated faults under the seabed), and using our results (along with other information) to make a cross section of how heat is distributed down the subduction zone, we were able to learn a little more about how earthquake prone the Makran may be. We found that the Makran has a very simple, almost cartoon-like accretionary prism structure (vastly easier to interpret than many other margins!), with few obstacles along the east-west length of the megathrust which would stop an earthquake extending sideways (and increasing its magnitude). This is important as the length of a rupture is directly related to its magnitude: one of the extraordinary features of the Sumatra 2004 event was its rupture length of >1200 km.


An example 2D seismic line showing the structure of the Makran accretionary prism. Width of view ~70 km.  Source: Smith et al. 2012

An example 2D seismic line showing the structure of the Makran accretionary prism. Width of view ~70 km.
Source: Smith et al. 2012

From our thermal modelling we also found that the Makran has the potential to experience seismic activity in the very shallow parts of the subduction zone, in a Tohoku-Oki and Sumatra like fashion. This is due to the extreme thickness of sediments above the plate boundary in this location, leading to a compressed and strong body of sediment capable of earthquake (brittle) rupture, rather than a mushy mess. Combining these features led us to conclude that the Makran may be capable of generating earthquakes of over magnitude 9, with associated tsunamis. Tsunamis in this region could impact the large cities of Karachi, Muscat and Mumbai, with devastating results.


Sumatra tsunami damage.  Source: en.wikipedia.org

Sumatra tsunami damage.
Source: en.wikipedia.org

What the Sumatra and Tohoku-Oki events showed was that (to quote one of the less scientifically accurate geology movies out there) – ‘there’s no history of anything until it happens’, and that basing current hazard assessments on historical behaviour can be risky, especially when the historical record is short. The Cascadia subduction zone is another cautionary tale. Historically thought of as largely aseismic, it was only the discovery of drowned forests and an orphan tsunami recorded in Japan which led to our current understanding of it as a margin with a long recurrence interval between large megathrust events.


With plans underway for the construction of two nuclear reactors near Karachi, well within the reach of any Makran sourced earthquakes, keeping an eye on this subduction zone and respecting its potential is surely more important than ever. So if you do happen to come across a map of global subduction zones….do me a favour and check that the Makran is on there!