Earthquake science may not be as intuitively simple to illustrate as something like volcanology, but we do definitely have the best maps. I have always been a pretty big map fan, and I think the spatial relationships in seismology and tectonics are some of the most interesting aspects of the whole discipline. However there is one aspect of seismicity maps which can be a little confusing……

Some Beach Balls.
Source: http://www.photo-dictionary.com/phrase/4388/beach-balls.html
Beach balls! (Ok really called focal mechanisms, but ‘beach ball’ is just much more fun). Whenever I’ve helped with teaching practicals in tectonics I have found that students can sometimes get a bit of a mental block on these and think that they are much more complicated than they really are. Once you know how to read them though, maps with beach balls on them can tell you so much about the tectonics of an area at a glance. A focal mechanism can tell you whether an individual earthquake is a thrust event (compressional), a normal event (extensional), or strike-slip. As they are also often also graded by size for magnitude and/or colour for depth, a good beach ball can really tell you a lot about what’s going on tectonically in an area. I find them so useful for getting a quick understanding of an area which I haven’t studied, or for visualising the tectonic context of a new earthquake. So basically, I think beach balls are great, and you really don’t have to be a structural geologist or seismologist to be able to get a lot of information out of them.

So how do you tell what all those little circles on maps like these mean? Beach balls are sometimes taught with stereonets, as they are a pretty similar concept, but if you understand stereonets then you’re probably already most of the way there with focal mechanisms, so I’m going to explain them from a stereonet-free perspective! I won’t go into all the nitty gritty about how they are made but I hope I can help to make maps of them seem accessible and easy to read!

Focal Mechanism examples. Source : upload.wikimedia.org
There are 3 basic shapes you will see on a beach ball:
Let’s call these:
1) Crisscross
2) Black in the middle
3) White in the middle
Let’s start with 2) and 3) as they go nicely together.
The way I remember what’s going on with a beach ball is to imagine that material is moving from white to black (or whatever shading colour is being used). This isn’t strictly what is happening (the rocks are actually being pushed or pulled according to their shading) but it just helps me to visualise what’s going on. There are occasionally maps which do the shading the other way round but it will be stated in the caption somewhere, and white is normally the ‘pull’.
So in one of these:

Extensional beach ball. Source: http://all-geo.org/highlyallochthonous
….the material is moving from the white bit in the middle, to the black sections at the side, so it is extensional (a stretching earthquake). Whereas with one of these….

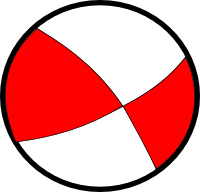
Compressional Beach Balls. Source: http://all-geo.org/highlyallochthonous/2011/03/magnitude-8-9-or-9-0-or-9-1-earthquake-off-the-coast-of-japan/
…the material is moving from the white sections at the side, to the coloured section (in this case red) in the middle, so it is compressional (a squishing earthquake). These are the kind of beach balls which you’ll see with big megathrust earthquakes.
In both of these examples, you can also tell the strike (orientation on a map) of the guilty fault. A beach ball is also a mini compass, with north at the top. The orientation of the lines gives you a rough strike. In the normal fault example, the inner white section is orientated approximately NW-SE, and in the thrust fault example the red inner section is orientated approximately NNE-SSW. These give you the respective fault orientations.
That leaves the crisscross beach ball:

Strike-slip example. Source: http://all-geo.org/highlyallochthonous/wp-content/uploads/2010/07/Haitifm.png
These are the easiest to spot at a glance, and show us that strike slip motion is occurring (you’ll see these along the San Andreas Fault, Anatolian Fault etc).
So now a map like this (which has helpfully colour coded the different types) becomes very friendly.

Selected seismicity of Italy/Croatia. Source: http://comet.nerc.ac.uk/images/fig1lo.jpg
At a glance you can see that central Italy is dominated by extension on NW- SE trending faults (‘white in the middle’ beach balls), the coast of Croatia is dominated by compressional earthquakes with the same trend (red in the middle), and that strike slip earthquakes (crisscross) are scattered around, with a couple in Sicily. You’ll also start to notice a few not so perfect examples (such as a thrust mechanism with a bit of crisscross going on). These reflect the oblique nature of many real-world earthquakes, which are often a combination of two end-members.
Easy! If you want to go a tiny bit further…..the other thing to know about beach balls is that they give you two possible earthquake fault planes. These fault planes are represented by the lines which separate the coloured and white sections. If this line runs straight across the middle of the circle then it is showing a near-vertical plane. If the line is curved round the edge, it’s a near-horizontal plane.
Therefore in our extensional example we have two possible fault planes, both of a moderate dip. This makes sense as we know that normal faults tend to have dips of ~60°. The possible fault planes dip towards the middle of the circle so this would be either a SW dipping plane or a NE dipping plane. There’s no way to tell which plane actually generated the earthquake without other external information.

Arrows point to potential fault planes
On our thrust beach ball, we are presented with two very different possible planes, rather than the symmetry of the normal beach ball. You do also get symmetrical thrust beach balls, but this is a nice example of what is commonly seen with megathrust earthquakes. This beach ball is telling us that the earthquake either occurred on a very shallow plane (the one running along the edge of the circle), or a very steep plane (the one running straight down the middle). In this case our geological knowledge can be helpful. We know that thrusts like to dip at a shallow angle, in some cases very shallow (<5°), so the shallow plane is a definite possibility. We also know that a vertical thrust would be geometrically unusual, so the very steep plane is pretty unlikely. If you see a beach ball like this in a subduction zone setting, its generally a pretty safe bet that the earthquake has occurred on the shallow subduction zone megathrust (with implications for tsunami hazards etc.)

Arrows point to potential fault planes
Lastly our strike slip example. Remembering that material ‘moves’ from white to red, you end up with a couple of options. You can definitely tell that the fault plane is likely to be pretty much vertical, as both of the lines run straight across the ball. This fits with what we know as strike slip faults like to be pretty steep, if not perfectly vertical. This beach ball therefore gives us two scenarios.

Arrows indicate direction of movement, with associated fault plane highlighted in green
A sinistral (movement to the left) earthquake on a ~ SW-NE fault, or…..

Arrows indicate direction of movement, with associated fault plane highlighted in green
…..a dextral (movement to the right) earthquake on a ~ NW-SE fault.
The best way to know which is right – is to look at a map! Strike slip faults often have a surface expression (or will have been helpfully interpreted onto the map), so if you can see a likely culprit fault, you’ll be able to match it to the correct plane on the beach ball.
Beach balls have even more exciting uses when you plot them in 3D, but for now I hope that helps make beach balls maps more approachable.
If you’d like to know more about how beach balls are made, this video from IRIS is excellent!
